
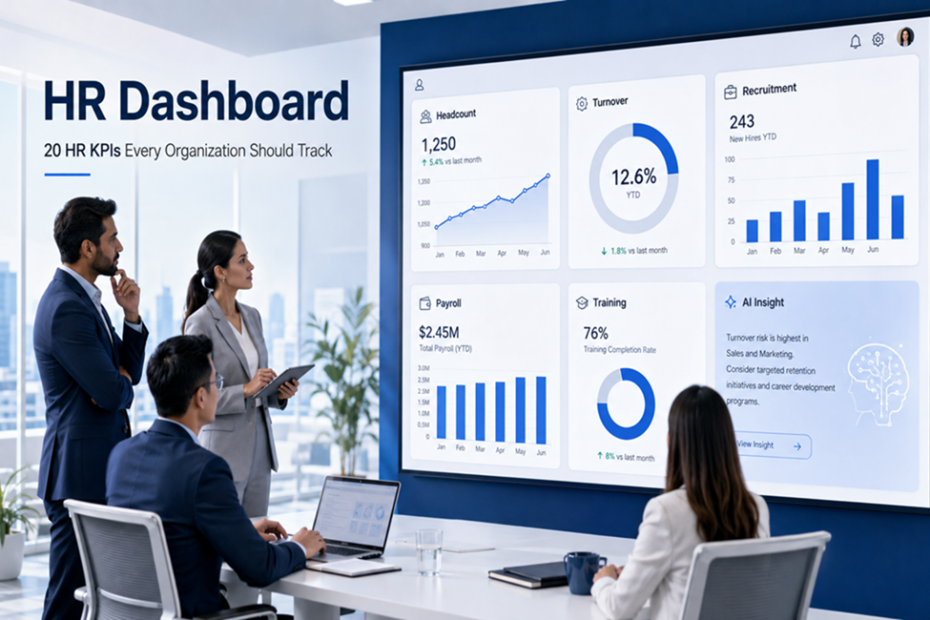
Organizations today generate more employee data than ever before—from headcount, attendance, leave, overtime, and payroll to recruitment, training, and performance data.
The challenge for HR is no longer a lack of data. Instead, it is having large volumes of data without being able to use them effectively for decision-making.
When executives ask questions such as:
- Why has employee turnover increased this month?
- Which departments have unusually high overtime?
- How much has workforce cost increased as headcount grows?
- Is the recruitment process taking longer?
- Which employee groups have significant skill gaps?
If HR teams have to access multiple systems, download reports, and consolidate data in Excel every time these questions arise, getting an answer may take hours—or even days.
This is why an HR Dashboard has become an important tool for both HR teams and executives. It transforms large volumes of workforce data into KPIs, charts, trends, and insights that are easier to understand and use for decision-making.
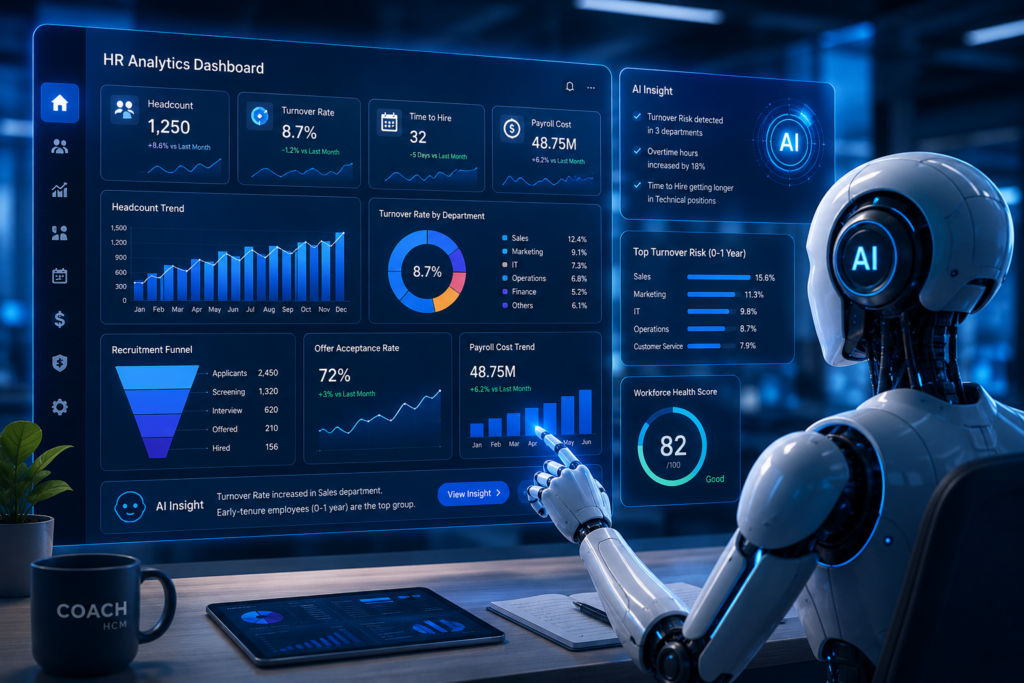
As AI for HR continues to play a greater role in human resource management, HR Dashboards in 2026 are also evolving beyond simply showing “what happened” toward helping organizations identify “what is changing and what requires attention.”
What Is an HR Dashboard?
An HR Dashboard is a tool that consolidates and presents important human resource data in an easy-to-understand format, such as KPIs, numbers, charts, trends, and comparisons.
It helps HR teams and executives monitor workforce conditions and use data to support better decision-making.
An HR Dashboard may include information such as:
Headcount, Turnover, Attendance, Leave, Overtime, Payroll Cost, Recruitment, Performance, Training, Competency, and Talent Management.
However, an effective dashboard does not mean displaying every available piece of information at once. The key is to select the data that helps answer relevant business questions.
For example, if the dashboard shows that employee turnover has increased compared with the previous month, executives should be able to drill down further to identify which departments, positions, or employee tenure groups are driving the change.
An HR Dashboard should therefore be more than a screen filled with charts. It should function as a Decision Support Tool that transforms HR Data into information that can be used in practice.
What Is the Difference Between an HR Report, HR Dashboard, and HR Analytics?
Although HR Reports, HR Dashboards, and HR Analytics all involve workforce data, they serve different purposes.
| Area | HR Report | HR Dashboard | HR Analytics |
|---|---|---|---|
| Purpose | Report information | Monitor current conditions | Analyze and uncover insights |
| Format | Tables / Documents | KPIs / Charts / Visualizations | Multidimensional data analysis |
| Main Question | What happened? | What is happening now? | Why is it happening? |
| Usage | Periodic | Continuous | In-depth analysis |
| Users | HR / Payroll | HR / Managers / Executives | HR Leaders / Analysts / Management |
A simple example:
HR Report
25 employees left the organization this month.
HR Dashboard
The Turnover Rate increased from 8% to 11%, with the Sales department recording the highest turnover.
HR Analytics
Further analysis shows that the increase in turnover is concentrated among employees with less than one year of service.
When these three components work together, organizations can move beyond simply having Data toward generating meaningful Insights for workforce management.
Why Do Modern Organizations Need an HR Dashboard?
The role of HR is evolving from primarily operational responsibilities toward becoming a Strategic Partner to the business.
As a result, executive questions are changing.
Instead of simply asking:
“How many employees do we have?”
Leaders increasingly want to know:
“How much has Labor Cost increased as Headcount grows?”
“Why is overtime continuously increasing in this department?”
“Is our recruitment process becoming more efficient?”
“Is the increase in Turnover affecting Critical Positions?”
1. Get a Consolidated View of the Workforce
Instead of collecting information from multiple reports, executives can view Headcount, Turnover, Attendance, Recruitment, and workforce costs from a consolidated perspective.
2. See Trends, Not Just Numbers
A Turnover Rate of 10% on its own may not provide enough context.
However, if the dashboard shows:
6% → 7% → 8% → 10%
executives can immediately see that the trend may require further investigation.
3. Identify Data Anomalies More Easily
An HR Dashboard can make unusual patterns easier to notice, such as:
- Increasing overtime
- Rising absenteeism
- Longer Time to Hire
- Declining Offer Acceptance Rates
- Unexpected increases in Payroll Cost
4. Reduce Manual Reporting
When dashboard data is connected to source systems, HR teams can reduce the time spent exporting, consolidating, and formatting Excel reports repeatedly.
5. Help HR Speak the Language of Business
Instead of reporting:
“40 employees resigned this month.”
HR can provide more meaningful context:
“Turnover increased by 3 percentage points compared with the same period last year, with most resignations occurring among employees with less than one year of service.”
The second statement provides far more value for decision-making.
20 HR KPIs Executives and HR Teams Should Track
There is no single set of KPIs that is appropriate for every organization.
However, the following 20 HR KPIs and Metrics can serve as a starting framework for designing an HR Dashboard. Organizations should define the calculation methodology, targets, and benchmarks according to their own business context.
Workforce Dashboard
- Headcount
The total number of employees in the organization, which can be analyzed by department, business unit, location, employee type, or other relevant dimensions.
- Employee Growth
Tracks changes in workforce size over time and can be compared with workforce plans or business growth.
- Diversity
Provides visibility into workforce composition across relevant demographic or organizational dimensions, based on the organization’s policies and applicable data governance requirements.
- Turnover Rate
Tracks employee turnover and can be analyzed by department, position, tenure, employee level, or other relevant dimensions.
Recruitment Dashboard
- Time to Hire
Measures the time taken from when a candidate enters the recruitment process until they are hired.
- Cost per Hire
Measures the average cost incurred by the organization to hire one employee.
- Offer Acceptance Rate
Measures the percentage of candidates who accept employment offers.
A declining rate may indicate issues related to compensation, employer branding, candidate experience, or the recruitment process.
- Source of Hire
Identifies where successful hires come from, such as job boards, employee referrals, career websites, or recruitment agencies.
Time Attendance Dashboard
- Leave Rate
Tracks employee leave patterns and trends across the workforce.
- Overtime
Monitors overtime hours by department, period, or employee group.
- Late
Tracks employee lateness and helps identify recurring patterns or unusual trends.
- Absenteeism
Monitors employee absence rates and can support workforce availability and capacity analysis.
Payroll Dashboard
- Payroll Cost
Tracks total payroll expenses and compares them with budgets or previous periods.
- Benefit Cost
Tracks employee benefit expenses and helps provide a more complete picture of total workforce cost.
- Labor Cost
Measures overall labor-related costs and can be analyzed alongside Headcount or business performance.
- Salary Trend
Tracks compensation trends over time across employee grades, positions, or other workforce segments.
Performance & Learning Dashboard
- KPI Achievement
Tracks the level of goal achievement across employees, departments, or the organization.
- Competency
Shows employee competency levels and identifies gaps between required and current competency levels.
- Training Hours
Tracks employee training hours and progress against development plans.
- High Performer
Provides visibility into high-performing employee groups to support Talent Management, Career Development, and Succession Planning.
Recommendation: Organizations do not need to display all 20 KPIs on a single dashboard. Instead, select the metrics that are most relevant to each user role and business objective so that the dashboard remains easy to understand and useful for decision-making.
Should Executives and HR Teams Use the Same HR Dashboard
Not necessarily.
CEOs, HR Directors, HR Managers, Payroll teams, Recruiters, and Line Managers have different questions and decision-making responsibilities.
| User | Dashboard Priorities |
|---|---|
| CEO / Executive | Headcount, Labor Cost, Turnover, Workforce Trend |
| CHRO / HR Director | Turnover, Recruitment, Performance, Talent, Learning |
| HR Manager | Attendance, Leave, Recruitment, Training, Employee Movement |
| Payroll | Payroll Cost, OT, Payroll Variance |
| Recruiter | Vacancy, Time to Hire, Recruitment Funnel, Offer Acceptance |
| Line Manager | Team Attendance, Leave, Performance, Training |
The key principle is:
Do not start designing a dashboard by asking, “What data do we have?” Start by asking, “What decisions does the user need to make?”
Which HR KPIs Should Be Monitored Daily, Monthly, or Quarterly?
Not every metric on an HR Dashboard needs to be updated in real time.
Daily / Operational
Attendance, Leave, Late, Absent, OT
Weekly
Vacancy, Recruitment Funnel, Workforce Availability
Monthly
Headcount, Turnover, Payroll Cost, Absenteeism, Time to Hire
Quarterly / Strategic
Performance, Competency, Skill Gap, Talent, and Succession
Therefore, a Real-Time HR Dashboard should not necessarily mean that every KPI updates every second.
Instead, the data should be timely enough to support the decisions for which it is intended.
From Excel to AI: HR Dashboard Maturity Model
Organizations can assess their HR Analytics maturity across five levels.
Level 1 — Excel / Manual Reporting
HR manually consolidates data and creates reports.
Level 2 — Standardized Reporting
The organization establishes more consistent templates and KPI definitions, although manual processes are still involved.
Level 3 — Interactive Dashboard
Data is presented through interactive dashboards with filtering and drill-down capabilities.
Level 4 — Predictive Analytics
Statistical models or Machine Learning are introduced to identify patterns and analyze potential trends.
Level 5 — AI-Assisted Insights
AI helps identify patterns, summarize insights, detect anomalies, or enable users to access information through natural language.
However, adopting AI does not automatically mean that an organization has effective HR Analytics.
A Level 3 Dashboard built on accurate, well-governed data may create more business value than an AI Dashboard built on poor-quality data.
How Is AI Transforming HR Dashboards in 2026?
Traditional dashboards require users to open charts, interpret the data, and identify insights themselves.
AI is beginning to help shorten the journey from:
Data → Insight
According to Gartner’s research on AI in People Analytics, AI has the potential to move People Analytics beyond data management toward greater insight delivery. At the same time, the use of AI with HR data and talent-related decisions requires appropriate risk management and governance.
AI can support HR Dashboards and Analytics in several ways.
Automated Insights
AI can help summarize important changes across large datasets.
For example:
“Turnover increased compared with the previous period, with most of the change coming from Departments A and B.”
Anomaly Detection
AI can help identify unusual patterns, such as:
- Rapid increases in overtime
- Higher absenteeism
- Longer recruitment cycles
- Unexpected changes in Payroll Cost
Natural Language Query
Users may be able to ask questions using natural language, such as:
“Which department had the highest Turnover Rate this quarter?”
instead of manually navigating multiple reports and filters.
Predictive Analytics
When organizations have sufficient data and appropriate models, AI and Machine Learning can help assess certain trends or potential future outcomes.
However, prediction is an input for decision-making—not a fact.
Decisions that affect employees should continue to involve appropriate human judgment, governance, and context.
Reference: Gartner, AI in People Analytics: Emerging Use Cases and Associated Risks, 2026.
7 Common HR Dashboard Mistakes
1. Including Too Many KPIs
The dashboard becomes a large report rather than a focused decision-support tool.
2. No Standard KPI Definitions
Different departments may calculate Headcount, Turnover, or other metrics differently, resulting in inconsistent information.
3. Prioritizing Attractive Charts Over Meaningful Information
Every visualization should have a clear purpose and help users understand or make a decision.
4. Showing Numbers Without Context
For example, a Turnover Rate of 8% means little without a target, historical trend, or benchmark for comparison.
5. No Drill-Down Capability
Users can see that there is a problem but cannot determine where it is occurring.
6. Poor Data Quality
Dashboards and AI cannot compensate for inaccurate or incomplete source data.
7. Failing to Control Data Access
HR Data includes personal and potentially sensitive information. Organizations should therefore consider Role-Based Access, PDPA requirements, Data Minimization, and Auditability when designing HR Dashboards.
Excel, BI, or an HR System: Which Is Best for an HR Dashboard?
The right approach depends on the complexity of the organization’s data and its objectives.
| Option | Best For | Advantages | Limitations |
|---|---|---|---|
| Excel | Organizations getting started / Less complex data | Flexible | High level of manual work |
| BI Tool | Organizations with multiple data sources | Advanced analysis and visualization | Requires an appropriate Data Model |
| HR System Dashboard | Operational HR Data | Direct connection to HR data | Capabilities depend on the HR system |
| HR System + BI | Advanced Analytics | Combines Operational and Strategic Analytics | Requires strong Data Architecture |
Before choosing the technology, organizations should first answer:
“What decisions do we want this data to support?”
6 Steps to Get Started With an HR Dashboard
Step 1 — Define the Business Question
Start with the problem the organization wants to understand, such as Turnover, Overtime, or Recruitment.
Step 2 — Select the Right KPIs
Choose only the metrics that help answer the business question.
Step 3 — Define the Data
Establish consistent definitions and calculation methodologies so that everyone interprets the KPIs in the same way.
Step 4 — Identify Data Sources
Determine where the required information is stored, such as HRIS, Payroll, Time Attendance, Recruitment, Performance, or Learning systems.
Step 5 — Design the Dashboard by User Role
Executives and HR Operations teams do not necessarily need to see the same information.
Step 6 — Review and Improve
Monitor which KPIs are actually being used and continuously improve the dashboard as business priorities change.
From HR Data to Insights With COACH HCM and AIRA
The foundation of an effective HR Dashboard does not begin with charts. It begins with well-structured HR Data.
COACH HCM helps organizations manage data across key HR processes, including Employee Data, Organization Management, Time Attendance, Payroll, Recruitment, Performance, Learning, and Talent Management within a unified platform.
This provides a stronger data foundation for reporting and analysis.
Organizations can also extend their HR data into Business Intelligence platforms to develop more advanced Workforce Analytics based on executive and business requirements.
Meanwhile, AIRA – AI Assistant for COACH HCM can support another layer of data utilization, such as helping users analyze and summarize information from reports so that insights can be accessed more efficiently.
The objective of AI is not to replace HR judgment, but to help shorten the journey from:
Data → Information → Insight → Decision → Action
This enables HR teams to spend more time on strategic analysis and decision-making.
Conclusion: The Best HR Dashboard Is Not the One With the Most Data
Organizations may have enormous volumes of HR Data, but that data only creates value when it can be used to support decisions.
An effective HR Dashboard should therefore not begin with:
“What data can we display?”
Instead, it should begin with:
“What decisions does the organization need to make?”
From there, organizations can select the appropriate KPIs, Data Sources, Visualizations, and level of analytics.
For organizations that are just getting started, an accurate dashboard covering Headcount, Turnover, Attendance, Recruitment, and Workforce Cost may already provide significant value.
As the organization’s Data Foundation becomes stronger, it can gradually advance toward People Analytics, Predictive Analytics, and AI-Assisted Insights.
The future of HR is not about having the largest amount of data.
It is about the ability to turn HR Data into Insights—and turn those Insights into Action faster and more effectively.
Read Related Articles : AI-Powered HR with AIRA
Read Related Articles : What is HR AI and AI Recruitment? The Beginning of Modern Workforce Management
Read Related Articles : What Is an Applicant Tracking System (ATS)? A Complete Guide to Choosing the Right Recruitment System
FAQ: Frequently Asked Questions About HR Dashboards
What Is an HR Dashboard?
An HR Dashboard is a tool that consolidates and presents important workforce information such as Headcount, Turnover, Attendance, Recruitment, Payroll, and Performance through KPIs, charts, and visualizations to help HR teams and executives monitor workforce conditions and make data-informed decisions.
What KPIs Should an HR Dashboard Include?
The right KPIs depend on the organization’s business objectives. Common metrics include Headcount, Turnover, Attendance, Overtime, Payroll Cost, Time to Hire, Performance, and Training.
What Is the Difference Between an HR Dashboard and HR Analytics?
An HR Dashboard focuses primarily on presenting current conditions and trends, while HR Analytics involves deeper analysis to identify patterns, relationships, and insights that can help answer business questions.
Can I Create an HR Dashboard in Excel?
Yes. Excel can be suitable for organizations with relatively simple datasets. However, as the number of data sources and users increases, an HR System or BI Tool can help reduce manual work and improve data management efficiency.
Does an HR Dashboard Need to Be Real-Time?
Not every metric needs to be real-time. Data frequency should match the decision being supported. Attendance may need to be monitored daily, while Performance or Succession data may only need to be reviewed periodically.
How Can AI Support an HR Dashboard?
AI can help summarize data, identify patterns, detect anomalies, support natural-language queries, and analyze certain trends, depending on the organization’s technology capabilities and Data Foundation.
Should Executives and HR Teams Use the Same Dashboard?
They can use the same underlying data, but the dashboard view should be tailored by role. Executives, HR Directors, HR Managers, Payroll teams, and Line Managers have different questions and decision-making responsibilities.
Where Should an Organization Start When Building an HR Dashboard?
Start by defining the Business Question. Then select the appropriate KPIs, establish Data Definitions, identify Data Sources, and design the dashboard around its primary users. More advanced Analytics and AI capabilities can then be added as the organization’s data maturity increases.
Turn HR Data Into Decision-Ready Insights With COACH HCM
Connect HR data across Employee Data, Time Attendance, Payroll, Recruitment, Performance, Learning, and Talent Management to create a structured data foundation that can be extended into HR Dashboards, Workforce Analytics, and AI.
With COACH HCM, organizations can move beyond simply collecting HR Data toward using workforce information more effectively to support better decisions.
 Interested in COACH HCM?
COACH HCM helps organizations manage HR, Payroll, Time Attendance, and labour-law-related changes more efficiently.